FAQ
Measuring Utilization or Adequacy of a Design
Measuring Utilization or Adequacy of a Design
At the end of the day, every civil and structural engineering design calculation is somehow comparing a force or a demand to a capacity. This is known as the design’s “utilization” or “adequacy”. There are, however, a few different ways of expressing this comparison, and which one you are most accustomed to can depend upon the country and specific sub-field that you’re working in.
 At ClearCalcs, we’re aiming to make engineering designs accessible to every engineer, and so we’ve chosen to standardize our entire platform around only one way of expressing the utilization: the demand to capacity ratio. We divide the demand by the capacity, and display this result as a color-coded percentage. So for example, a 50% in ClearCalcs would mean that the forces are equal to exactly half of what the design is capable of carrying - that you could nearly double the amount of load on that member and it would still be adequate.
To make these checks as easy as possible to interpret at a glance, we color-code the demand to capacity ratios:
At ClearCalcs, we’re aiming to make engineering designs accessible to every engineer, and so we’ve chosen to standardize our entire platform around only one way of expressing the utilization: the demand to capacity ratio. We divide the demand by the capacity, and display this result as a color-coded percentage. So for example, a 50% in ClearCalcs would mean that the forces are equal to exactly half of what the design is capable of carrying - that you could nearly double the amount of load on that member and it would still be adequate.
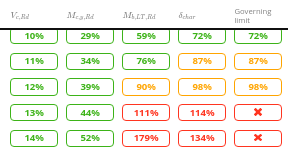
To make these checks as easy as possible to interpret at a glance, we color-code the demand to capacity ratios:
- A GREEN percentage means that the design is good and fully adequate, with room to spare.
- A YELLOW percentage means that the design is still good and passing all its checks, but is getting close to its limit (demand is above 85% of capacity). If you’re at all unsure of your loads or of the details of your design, then you might want to use extra caution here.
- A RED percentage means that the design is failing; it is NOT adequate and you can NOT use this design. Any percentage above 100% is bad and is failing, and will display in a bright red color.
- Additionally, a RED “X” means either that the design is failing very badly (that the percentage is above 1 000%), OR that the design is failing because of a hard limit set in a design standard not being met. For example, concrete standards typically require a hard minimum amount of reinforcement that must be present regardless of the demands on the member. If that minimum is not met, then we’ll display that failure as a red “X”, without a percentage.
Other Ways to Express Utilization
As we mentioned, in some countries and some sub-fields of civil and structural engineering, it may be more common to express design utilization using other systems. At ClearCalcs, we do NOT use these methods, but it’s important to know that they are measuring the exact same thing - they’re still just measuring how much a design is passing or failing by.- StruCalc “Adequate by” percentage: Users of the program StruCalc in the United States may be used to seeing an “adequate by” percentage, in which any percentage greater than 100% is passing, and any percentage less than 100% is failing. This is simply the reverse of what ClearCalcs and most other structural engineering software uses to display whether a design is passing or failing. In ClearCalcs, a lower utilization of your selected member will have a lower percentage and a higher utilization will have a higher percentage.
- CDR ratio (Capacity-to-Demand Ratio): In United States bridge design, it’s conventional to display utilization as a “CDR”. This method is exactly the inverse of what we show in ClearCalcs; a number greater than 1.0 is passing, and a number less than 1.0 is failing.
- FoS or FS (Factor of Safety): The Factor of Safety used in some geotechnical engineering designs effectively follows a similar convention, where you look at the assumed soil capacity divided by the demand. However, the minimum factor of safety required for a design to “pass” may or may not be equal 1.0. It is common to see a minimum overturning factor of safety of 1.5 in retaining wall design, for example, which means that any number less than 1.5 is failing, and any number greater than 1.5 is passing.